Computing the statistical power of Wilcoxon rank-sum tests
non-parametrics
statistical-power
Author
Rene Welch
Published
November 18, 2026
I learned about the Wilcox test when analyzing single-cell data; and always thought that it was the test to use whenever a parametric test didn’t work, then the next thing was to try and use Wilcox. Because of this, I never took the time to learn the hypothesis that we were testing for, or how to compute the power for that test.
Wilcox rank-sum test
For this test, we observe two groups of iid random variables \(X_1, \cdots, X_n \sim F_X\) and iid random variables \(Y_1,\cdots, Y_m \sim F_Y\), each with their own distribution, the random variables in one list are independent of the others, and typically \(n\neq m\). The hypothesis we want to test is:
\[H_0: P(X < Y) = P(X>Y)\] To test the hypothesis, we need to compute the \(U\) statistic, which is done by gathering the \(X\) and \(Y\) samples together into a list of random variables \(Z_1, Z_2, \cdots, Z_n, Z_{n+1},\cdots, Z_{n+m}\), which are then ranked together. Then, we compute the sum of the ranks of the \(X\) random variables, and the same for the \(Y\) random variables, we define those quantities as \(R_1\) and \(R_2\), respectively. Then, we use the \(U\) statistic defined as:
\[
\begin{aligned}
U &= \min (U_1 , U_2 ) \\
U_1 &= n \cdot m - \frac{(n)(n+1)}{2} - R_1 \\
U_2 &= n \cdot m - \frac{(m)(m+1)}{2} - R_2 \\
\end{aligned}
\]
The test is rarely solved manually, and can be computed using the wilcox.test function in R. Alternatively, we can use rstatix::wilcox_test that basically does the same but using a tidy format.
Computing the power via montecarlo simulations
For a continuous outcome, we can use the wmwpow R package (Mollan et al. 2020). This R package provides three alternatives to compute the power via simulations. Since I wanted to have the most control in my simulations, I used the wmwpowd function which computes the power given strings representing the simulating distributions \(F_X\) and \(F_Y\):
wmwpowd(n, m, distn, distm, sides, alpha =0.05, nsims =10000)
where:
n, m are the sample sizes of \(X\) and \(Y\), respectively
distn, distm are the \(F_X\), \(F_Y\) distributions; and use a syntax based on R’s simulation, e.g. norm(0, 1) would simulate from a \(N(0,1)\) and the syntax is based on the rnorm, qnorm, pnorm, etc.
sides configures the side of the alternative hypothesis
alpha is the significance of the test
nsims is the # of simulations
My goal was to study the power of tests where the sample size \(n + m\) was fixed and there could be an imbalance between the group sizes \(n\) and \(m\). Without loss of generality (using a two-sided test), we can say that \(n = \lfloor q \cdot (n + m) \rfloor\).
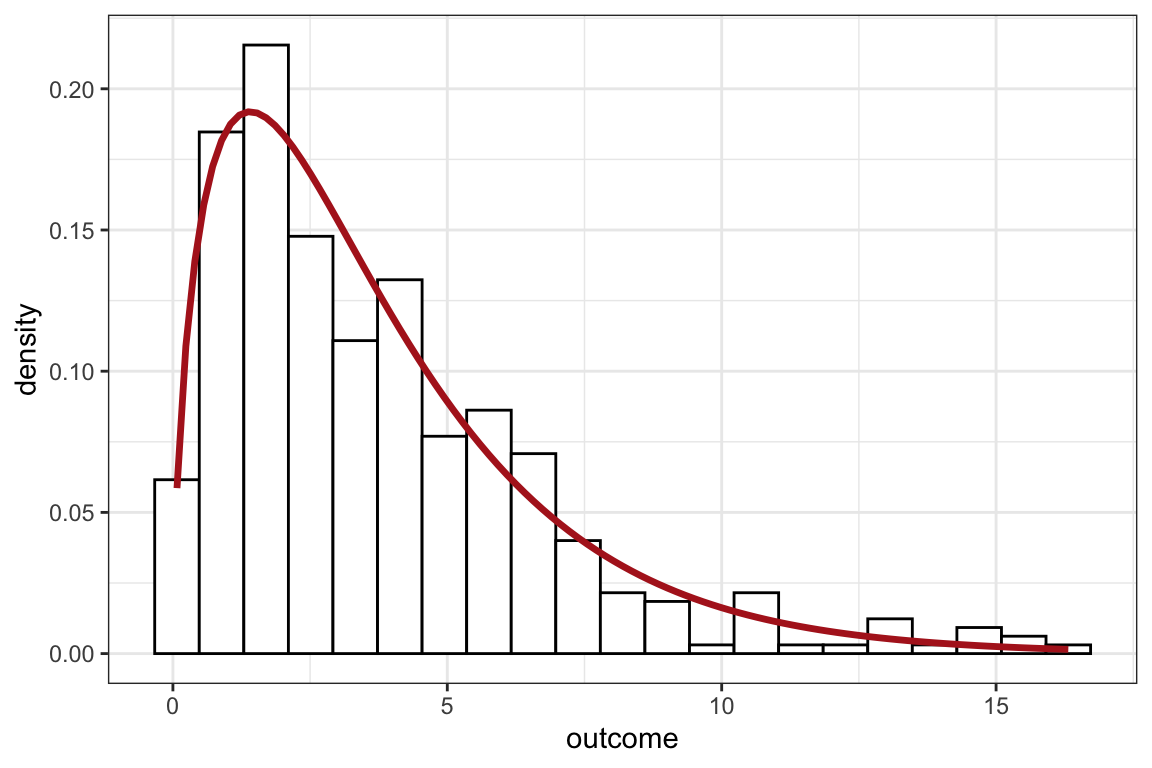
The first step is to define the distributions, for which I used the fitdistrplus R package (Delignette-Muller and Dutang 2015) to fit a Gamma distribution to my outcome variable.
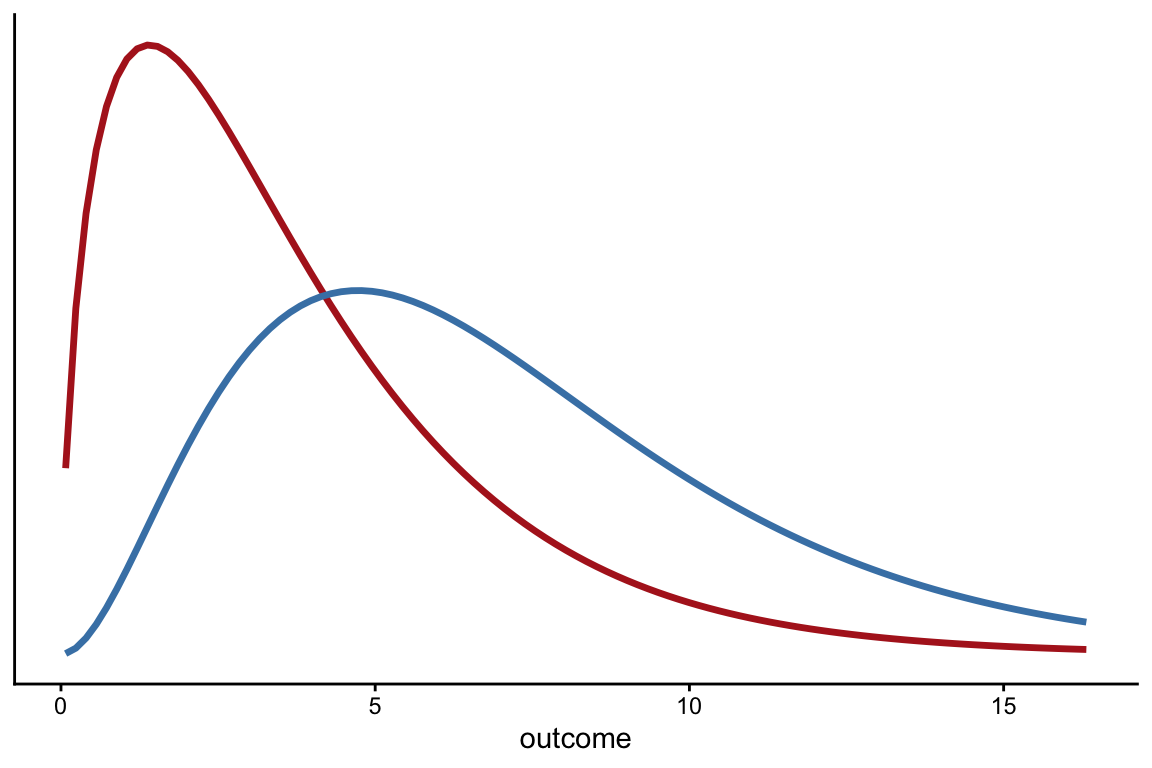
and using that distribution as baseline, I varied the shape parameter:
Figure 2: example for two distributions for X and Y
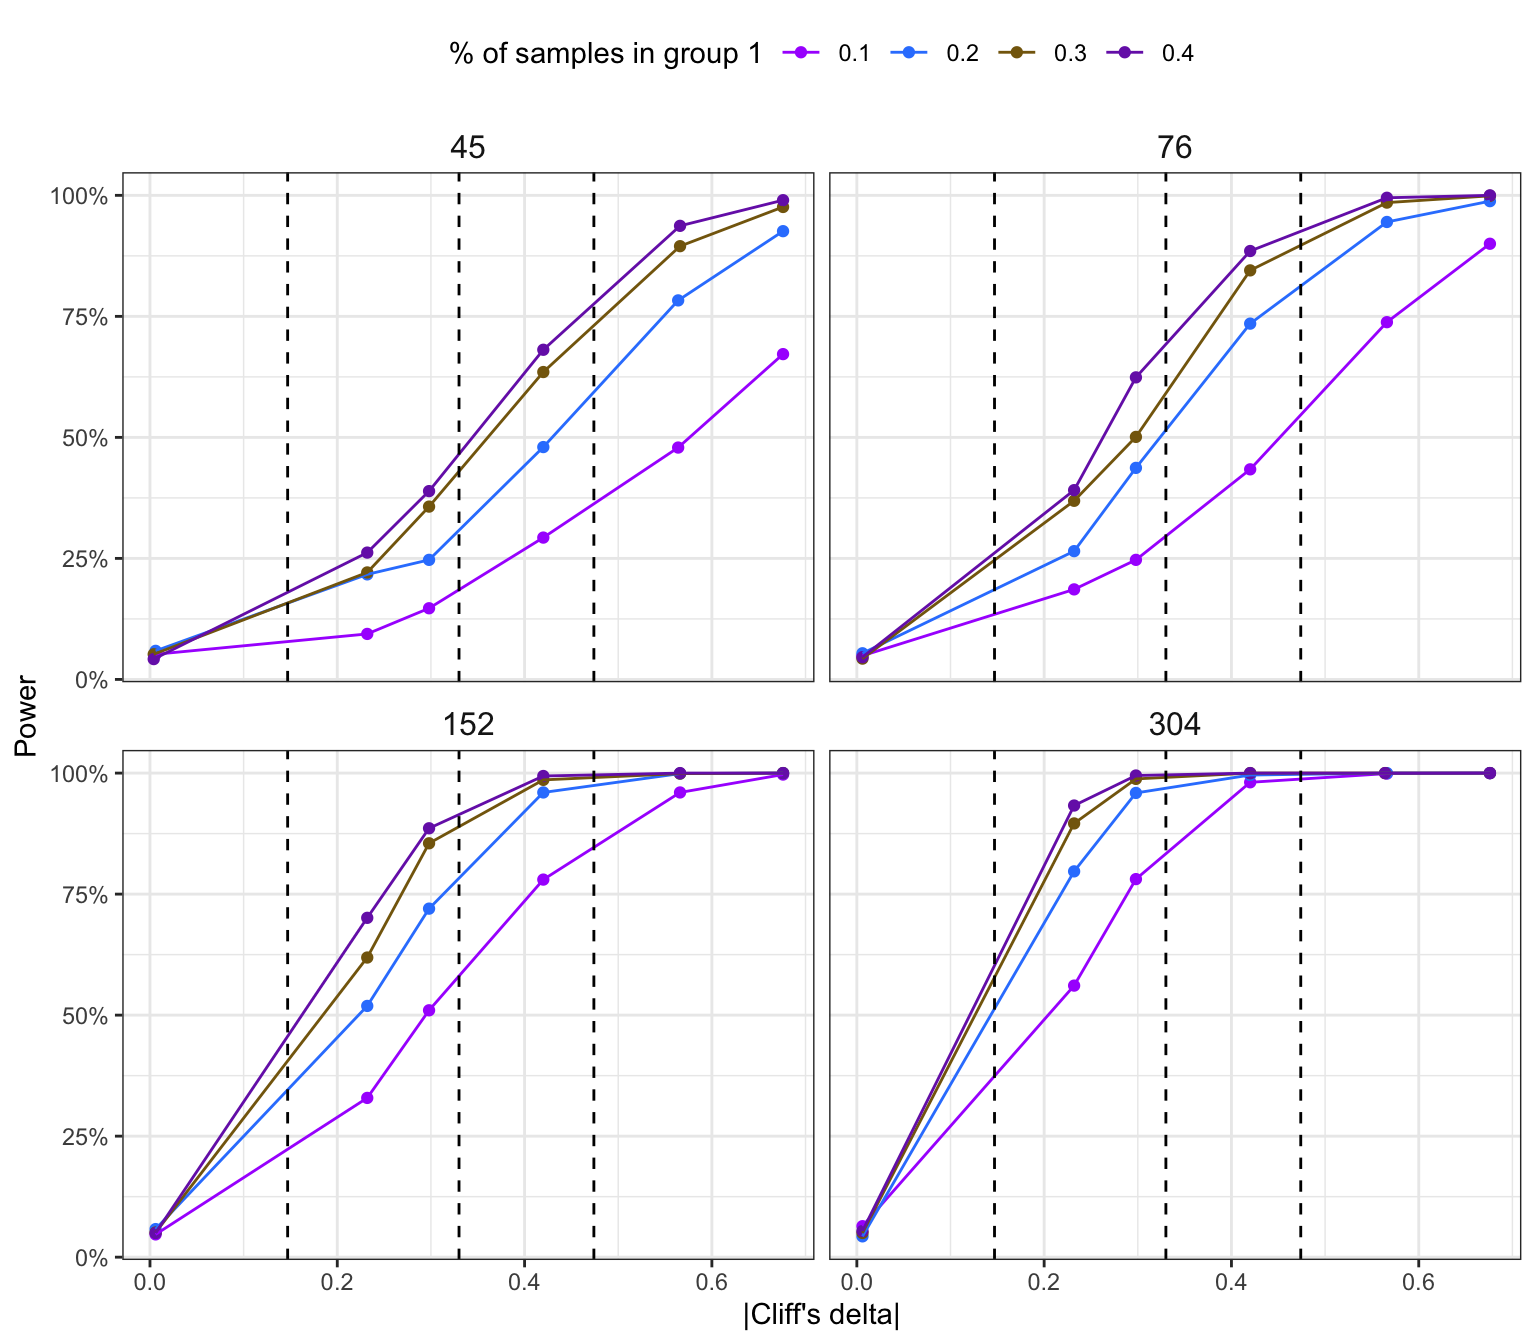
Repeating this framework for multiple sample sizes, and different sampling proportions \(q\) (which are the panel titles and colors in Figure 3, respectively). We were able to quantify the power. The power figure typically uses \(p=P(Y>X)\) in the x-axis, but since we also cared about the effect sizes, I used Cliff’s delta which is defined as \(\delta=1 - 2p\), and there are thresholds (the dashed lines in the figure below) that can be used to categorize the effect sizes:
Negligible: \(|\delta|< 0.147\)
Small: \(0.147 \leq |\delta| < 0.33\)
Medium: \(0.33 \leq |\delta | < 0.474\)
Large: \(|\delta| \geq 0.474\)
Figure 3 indicates that the statistical power of using Wilcoxon rank-sum tests is small when either a) the sample size is small or b) the groups are the most imbalanced.
Figure 3: Statistical power for Wilcox rank-sum test, with varying sample size per group
Extra
Using the R package targets, to have a reproducible pipeline to make this:
Delignette-Muller, Marie Laure, and Christophe Dutang. 2015. “fitdistrplus: AnRPackage for Fitting Distributions.”Journal of Statistical Software 64 (4): 1–34.
Mollan, Katie R, Ilana M Trumble, Sarah A Reifeis, et al. 2020. “Precise and accurate power of the rank-sum test for a continuous outcome.”Journal of Biopharmaceutical Statistics 30 (4): 639–48.