# A tibble: 4 × 2
  dist        data
  <chr>       <list>
1 normal      <tibble [40 × 2]>
2 exponential <tibble [40 × 2]>
3 t           <tibble [40 × 2]>
4 cauchy <tibble [40 × 2]>Using quarto templates with knitr
When analyzing data, I face the situation where I want to repeat the same sort of analysis for different aspect of the data, e.g. explore the relationship of batch effects with metadata variables, do differential expression analysis for all clusters in a single cell RNA-seq experiment, etc.
Template example
We first are going to generate a nested tibble that we are going to use for our example, in this case a nested tibble:
The analysis that we want do do is in the template.qmd file, and its contents look like:
## {{dist}}

```{.r}
#| label: "fig-data-{{dist}}"
#| include: true
#| echo: true
#| eval: true
#| fig-width: 6
#| fig-height: 6
#| out-width: "65%"
#| fig-cap: "Plot for {{dist}} distribution"

my_data <- all_data |>
    filter(dist == "{{dist}}") |>
    pluck("data", 1)

my_data |>
    ggplot(aes(x = x, y = y )) +
      geom_point()

```
The actual template can be downloaded from my GitHub repository. Then, to apply the template to all the distributions, we need to do three steps:
render_fun <- function(dist) {

 res <- knitr::knit_expand(
    file = "template.qmd",
      dist = dist)

  res

}

#| 1. replace `{dist}` for the element of `all_data$dist`
unparsed <- map(all_data$dist, render_fun)

#| 2 - send the `all_data` object inside an R environment
parsed <- knitr::knit_child(text = unlist(unparsed),
   envir = rlang::env(
    all_data = all_data
  ))
1/8
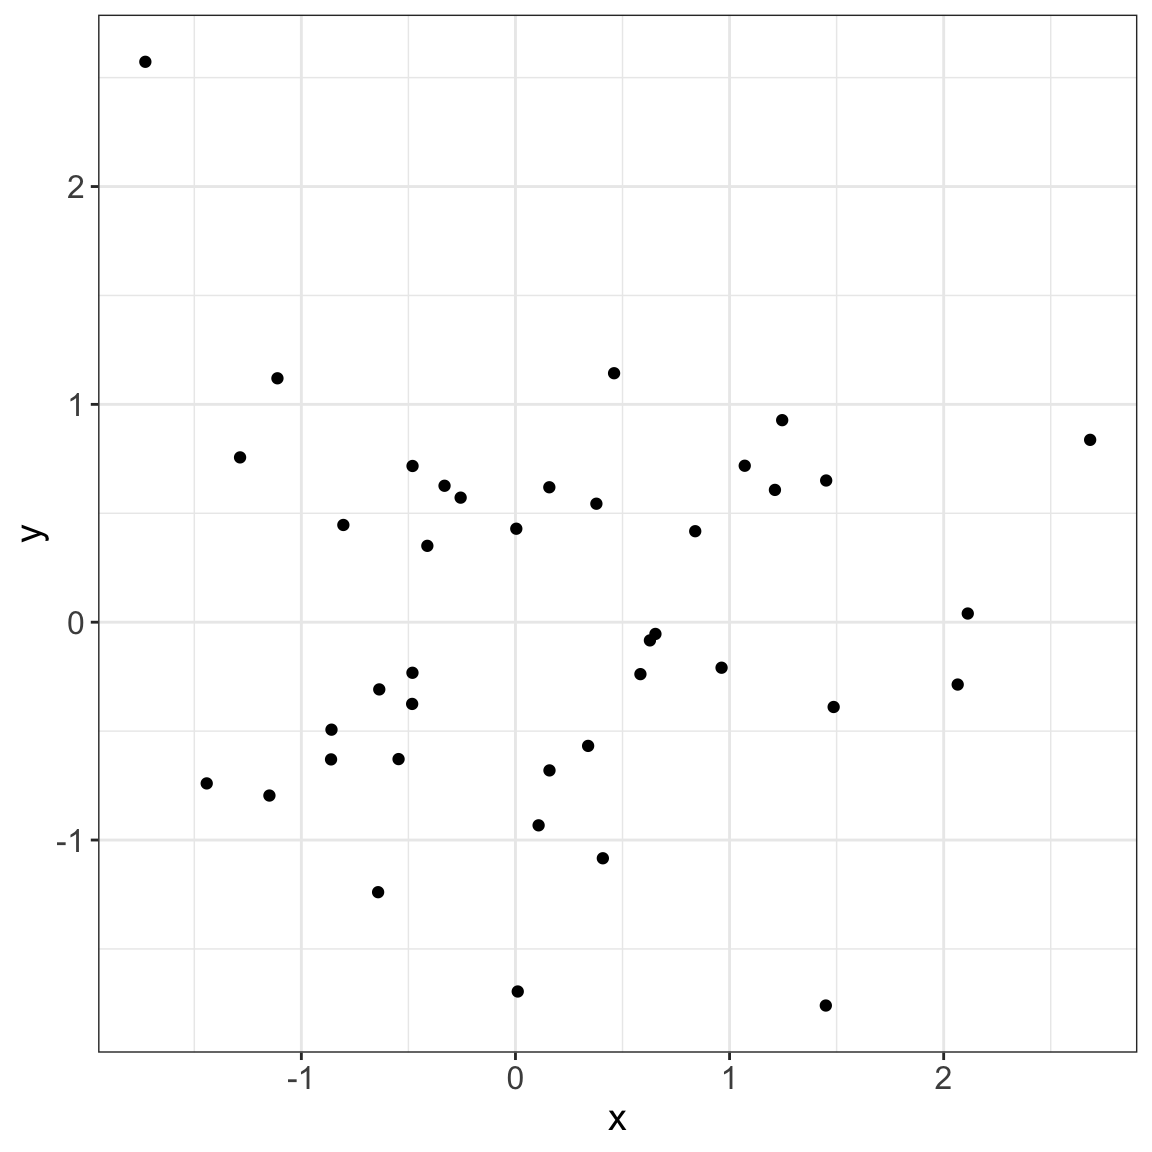
2/8 [fig-data-normal] 3/8
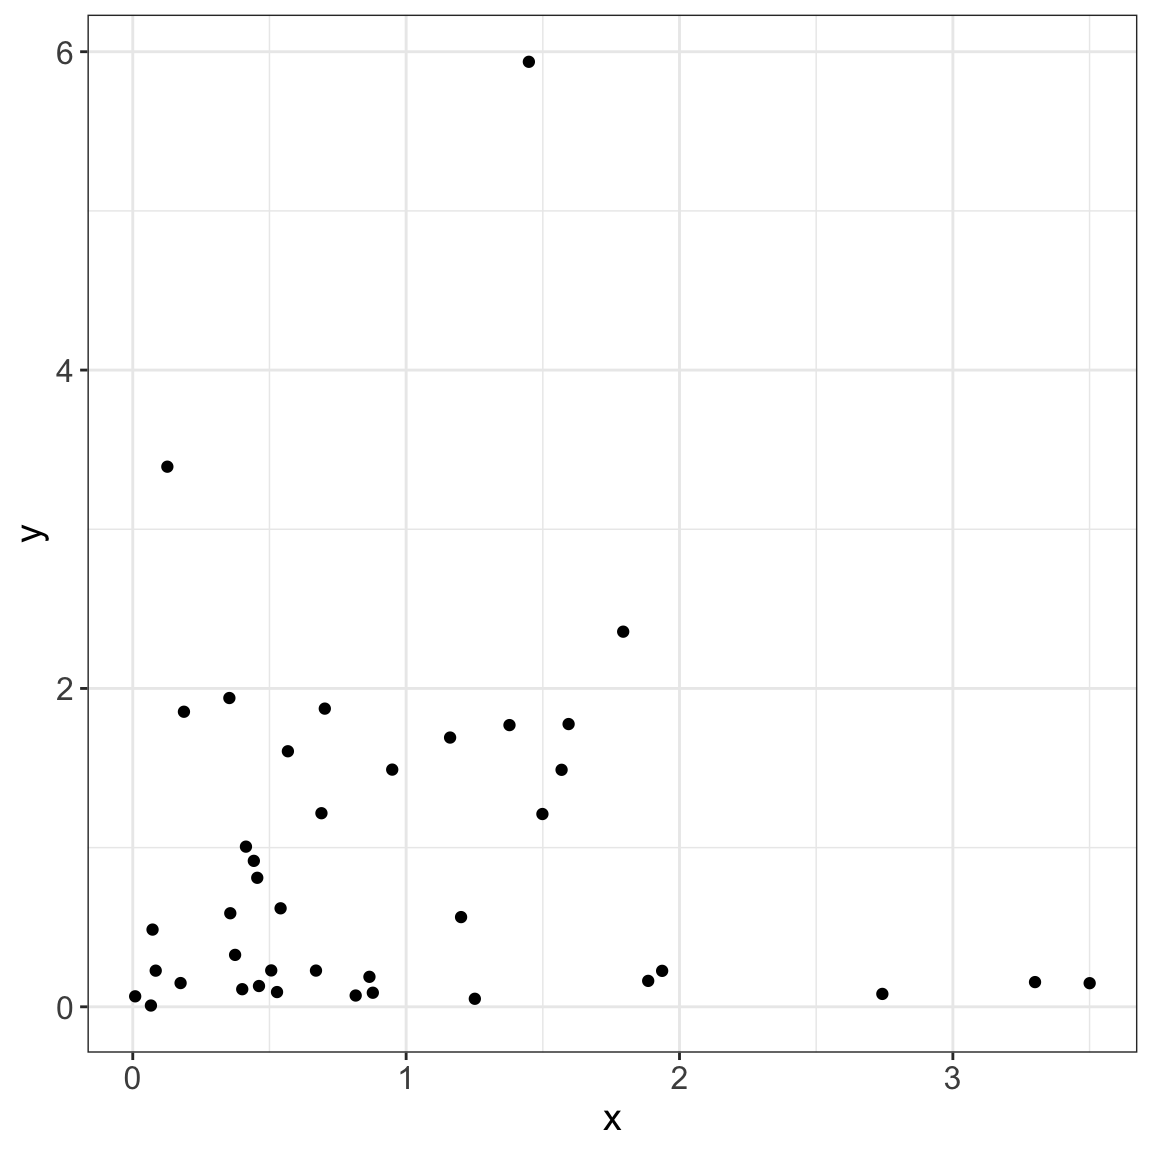
4/8 [fig-data-exponential]5/8
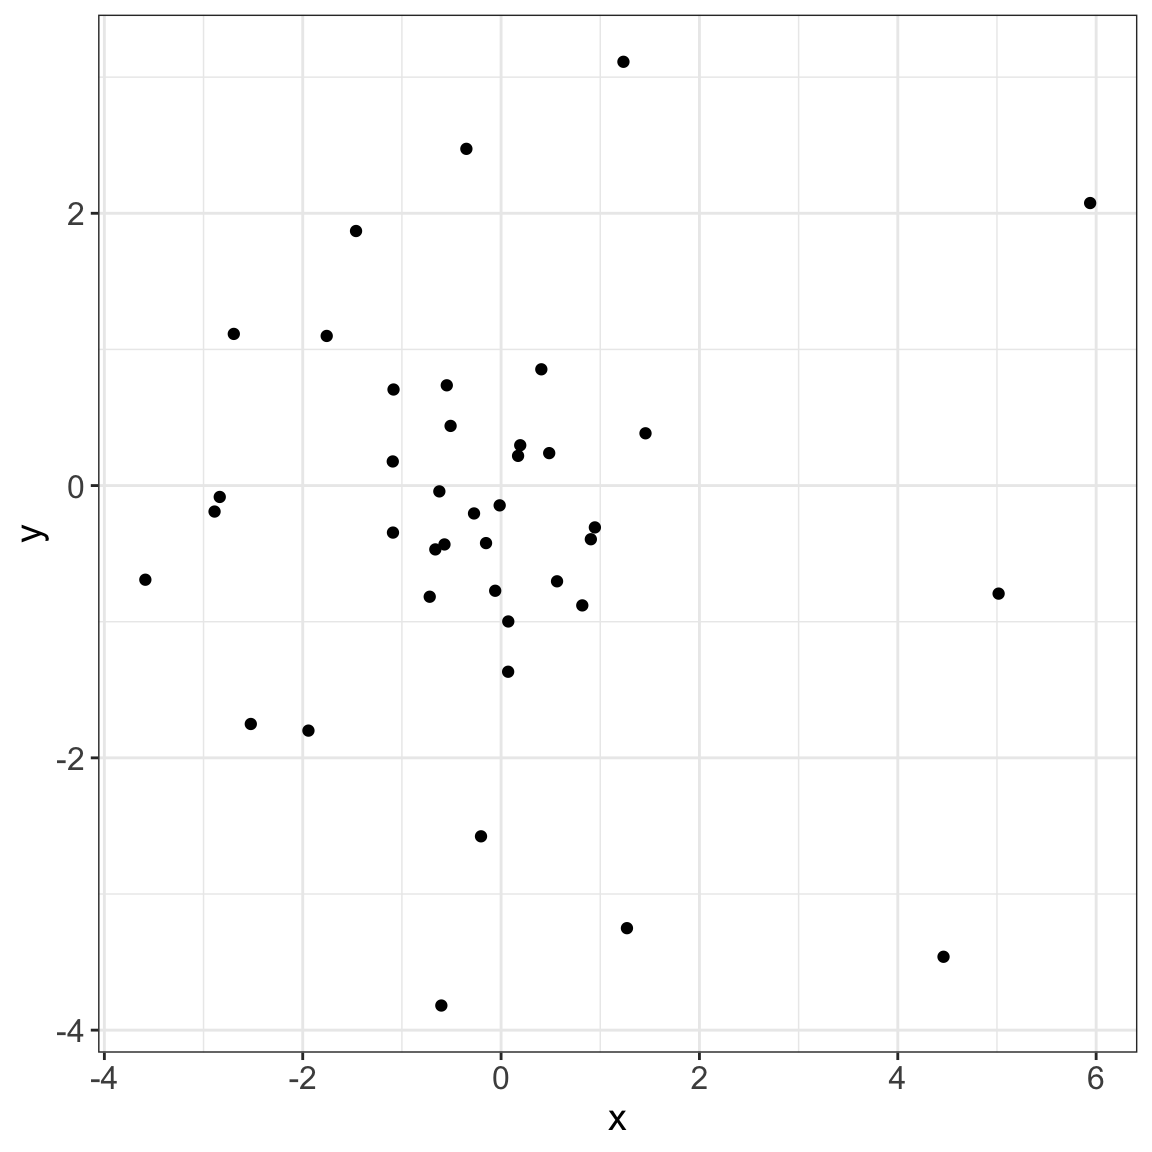
6/8 [fig-data-t] 7/8
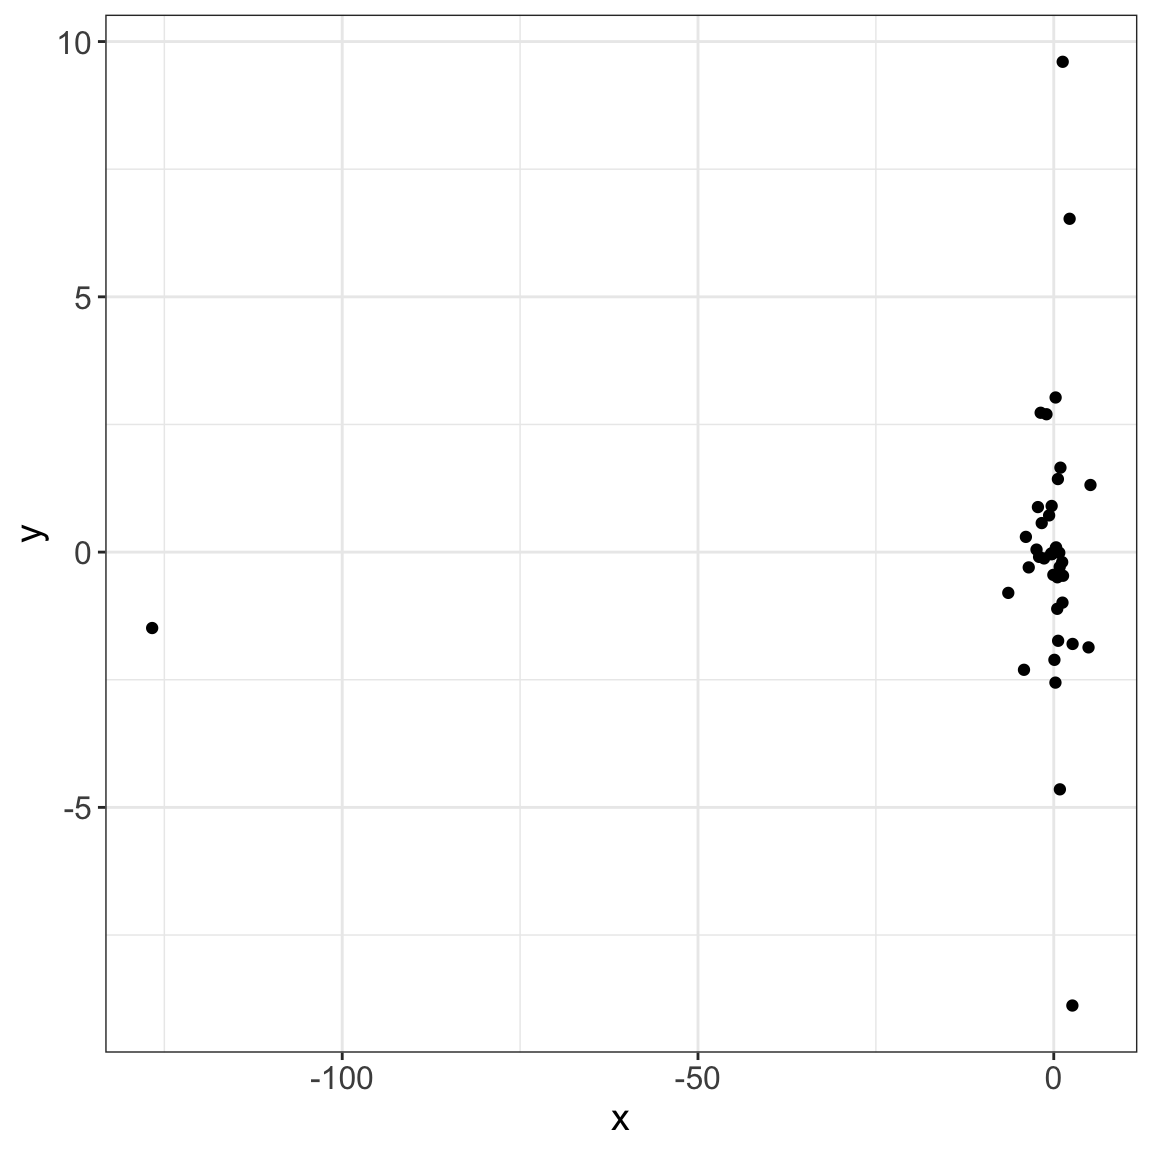
8/8 [fig-data-cauchy] Then, evaluate the parsed object inside a panel-tabset:
::: {.panel-tabset}

`.r parsed`

:::
This ends up looking as below, one tab for each distribution:


This process could facilitate the display of complex analysis!